Grafana - News Tutorial
Mohamad's interest is in Programming (Mobile, Web, Database and Machine Learning). He is studying at the Center For Artificial Intelligence Technology (CAIT), Universiti Kebangsaan Malaysia (UKM).
[0] Start Grafana System
Follow the previous tutorial i.e. https://mohamadrazzimy.hashnode.dev/grafana-setup-docker
Open PowerShell window. Change directory to home.
Change directory to mydockgraf directory.
Change directory to tutorial-environment.
cd ~
cd mydockgraf
cd tutorial-environment
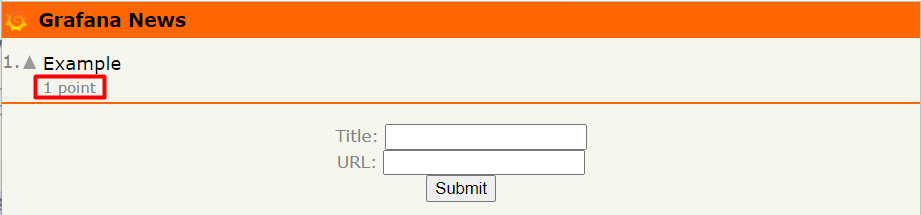
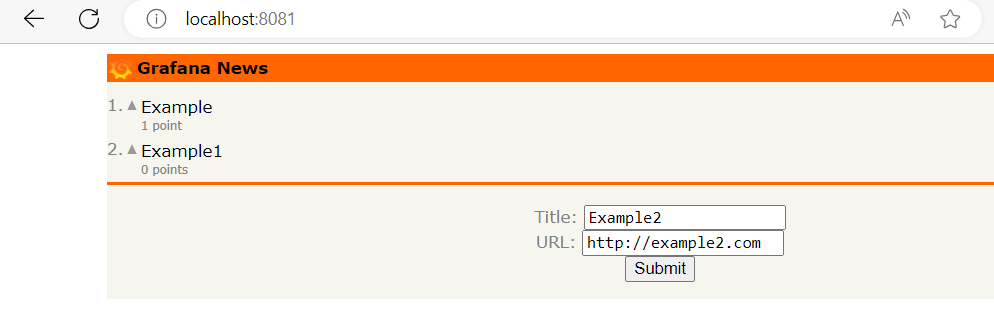
[1] Browse to the sample application on localhost:8081.
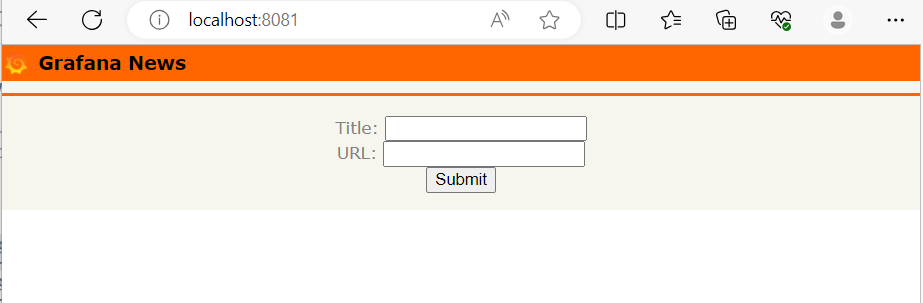
The sample application, Grafana News, lets you post links and vote for the ones you like.
To add a link:
In Title, enter Example.
In URL, enter https://example.com .
Click Submit to add the link.
The link appears in the list under the Grafana News heading.
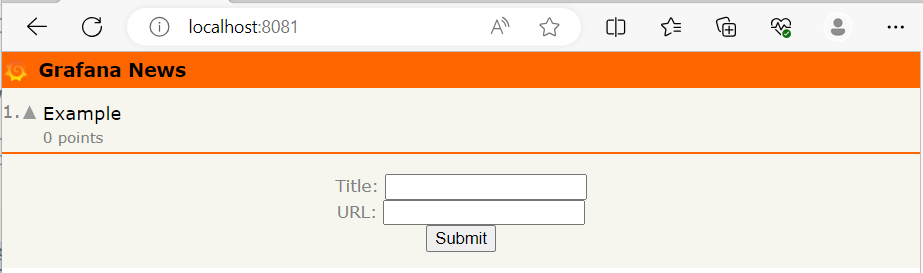
To vote for a link, click the triangle icon next to the name of the link.
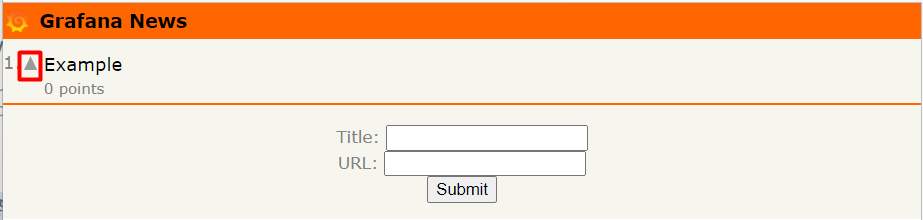
Outcome:
[2] Add a metrics data source
.
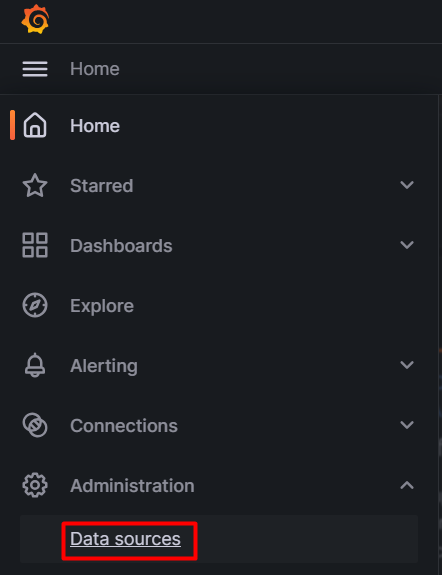
[1] In the sidebar, (1) click Administration (gear) icon, and then (2) click Data sources.
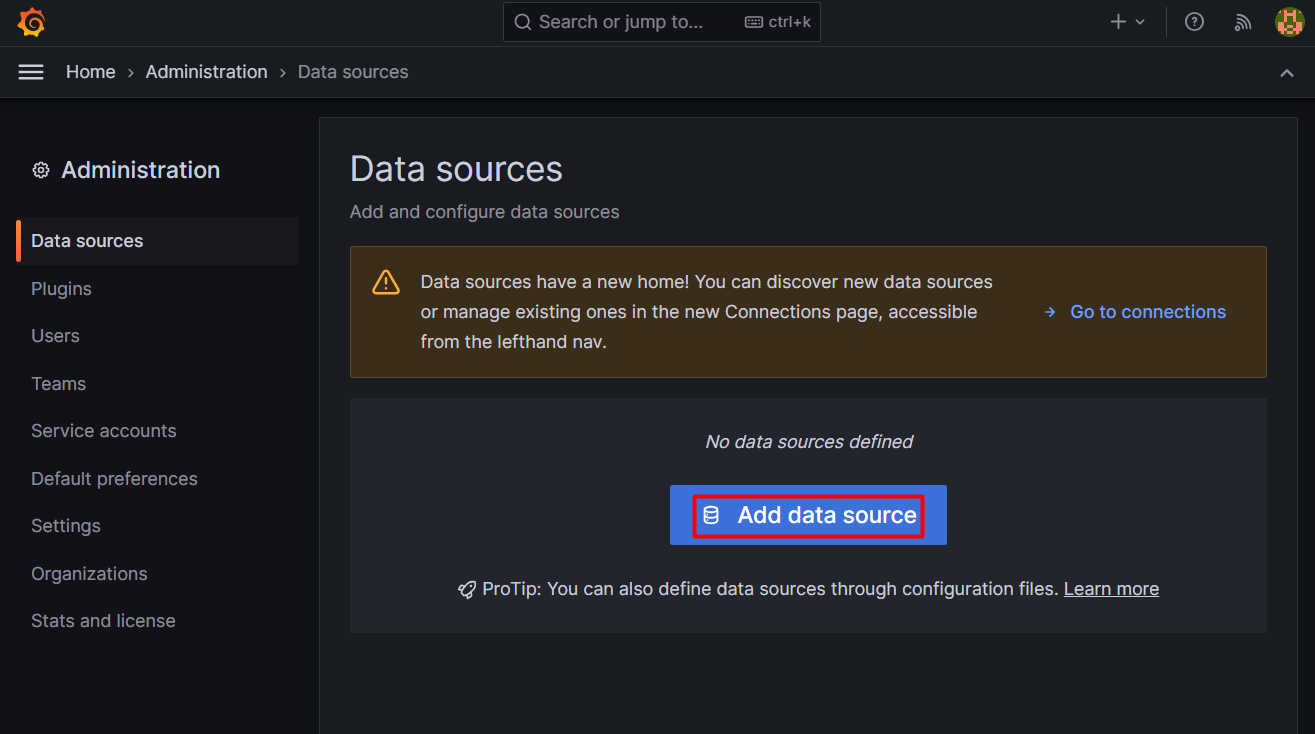
[2] Click Add data source.
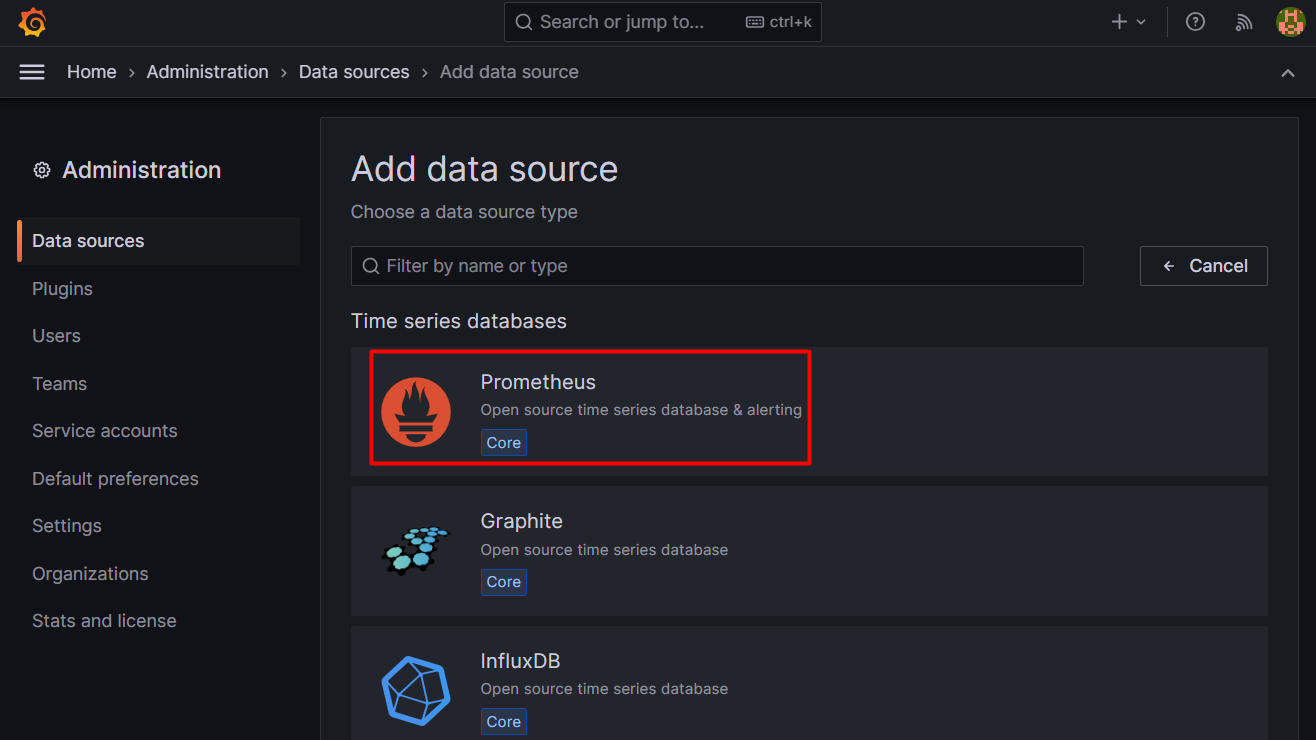
[3] In the list of data sources, click Prometheus.
[4] In the URL box, enter http://prometheus:9090.
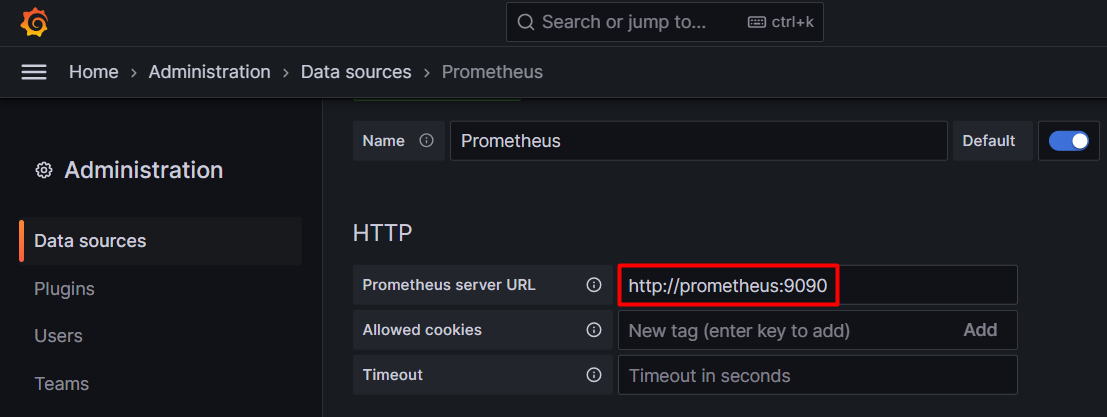
[5] Click Save & test.
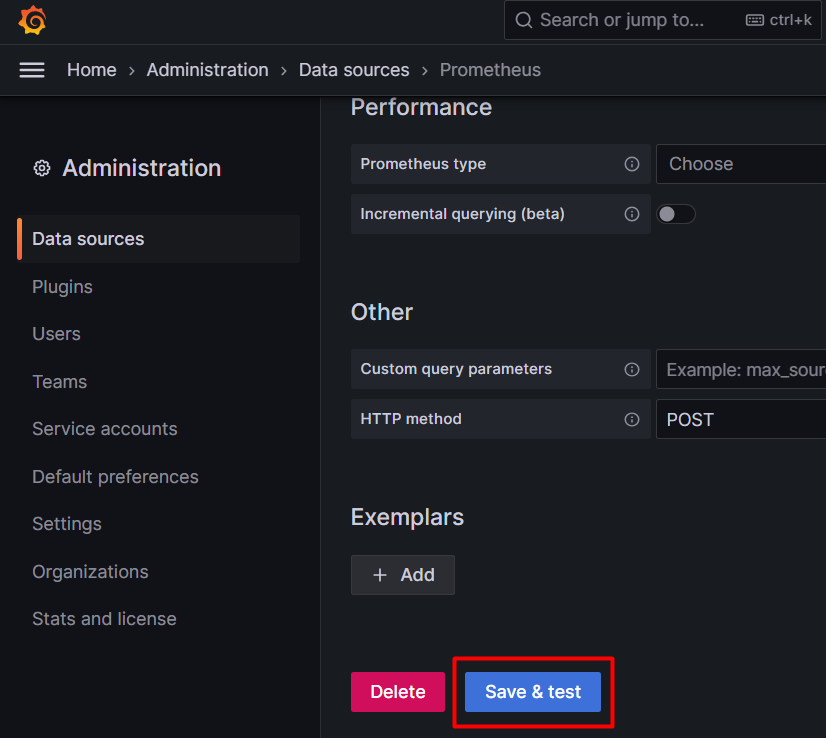
Outcome:

[3] Explore your metrics
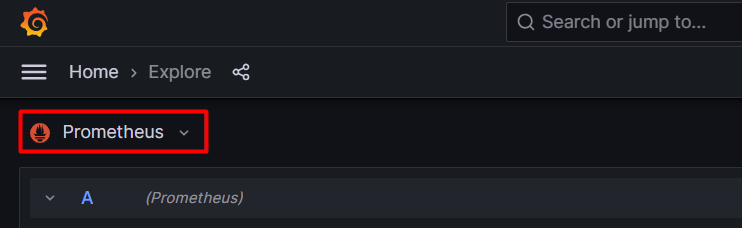
In the sidebar, click the Explore (compass) icon.

The Prometheus data source that you added will already be selected.
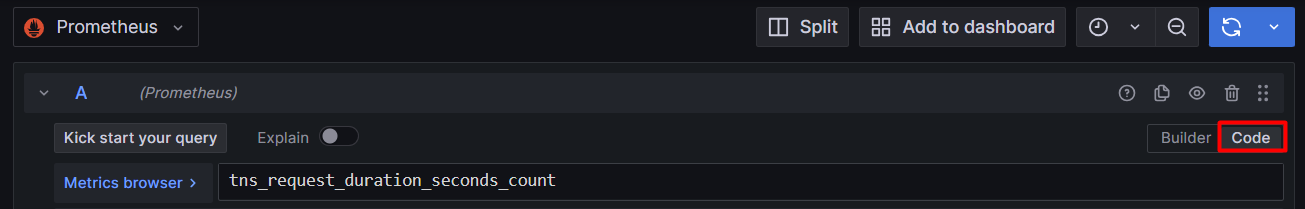
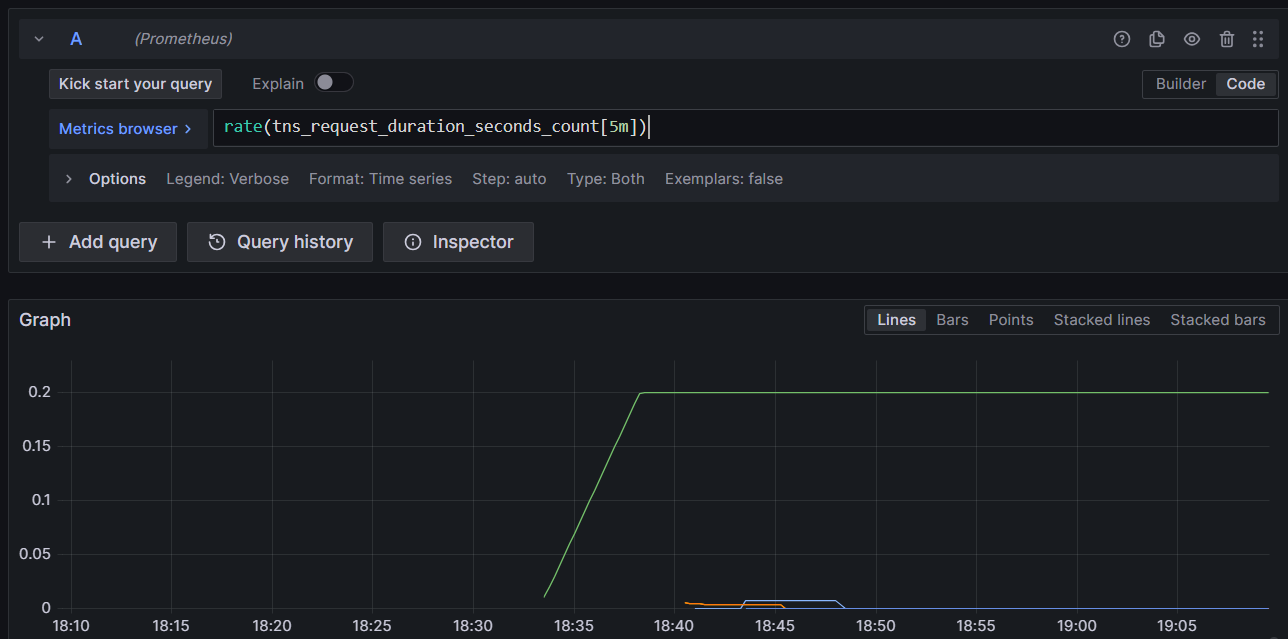
In the Query editor, where it says Enter a PromQL query…, enter
tns_request_duration_seconds_count
and then press Shift + Enter.
A graph appears.

In the top right corner, click the dropdown arrow on the Run Query button, and then select 5s.

Grafana runs your query and updates the graph every 5 seconds.
You just made your first PromQL query!
PromQL is a powerful query language that lets you select and aggregate time series data stored in Prometheus.
tns_request_duration_seconds_count is a counter, a type of metric whose value only ever increases.
Rather than visualizing the actual value, you can use counters to calculate the rate of change, i.e. how fast the value increases.
Add the rate function to your query to visualize the rate of requests per second. Enter the following in the Query editor and then press Shift + Enter.
rate(tns_request_duration_seconds_count[5m])
Immediately below the graph there’s an area where each time series is listed with a colored icon next to it. This area is called the legend.

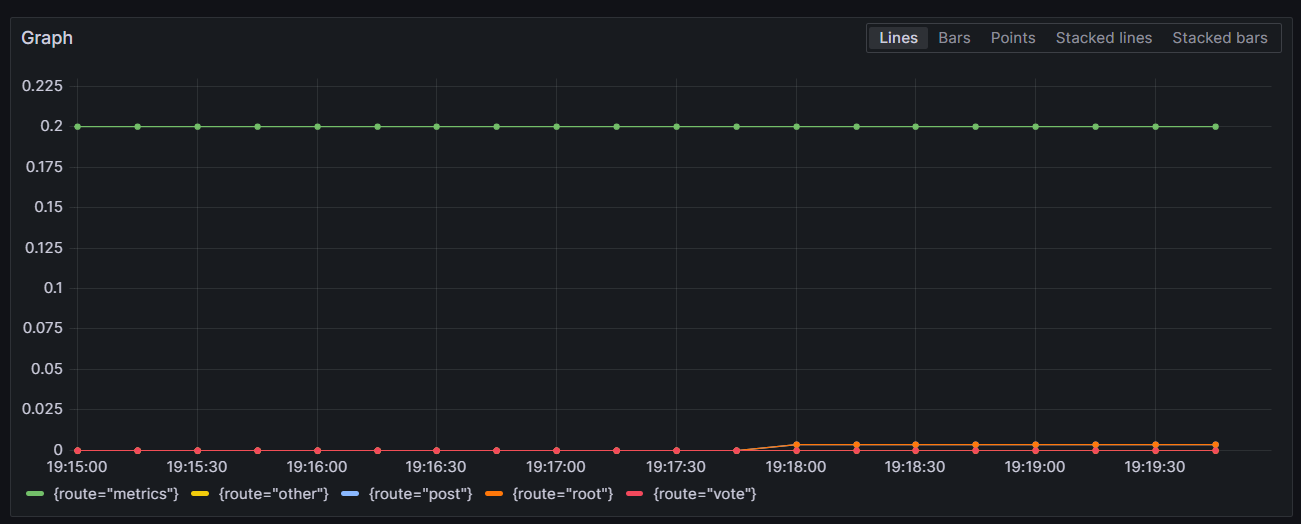
PromQL lets you group the time series by their labels, using the sum aggregation operator.
Add the sum aggregation operator to your query to group time series by route:
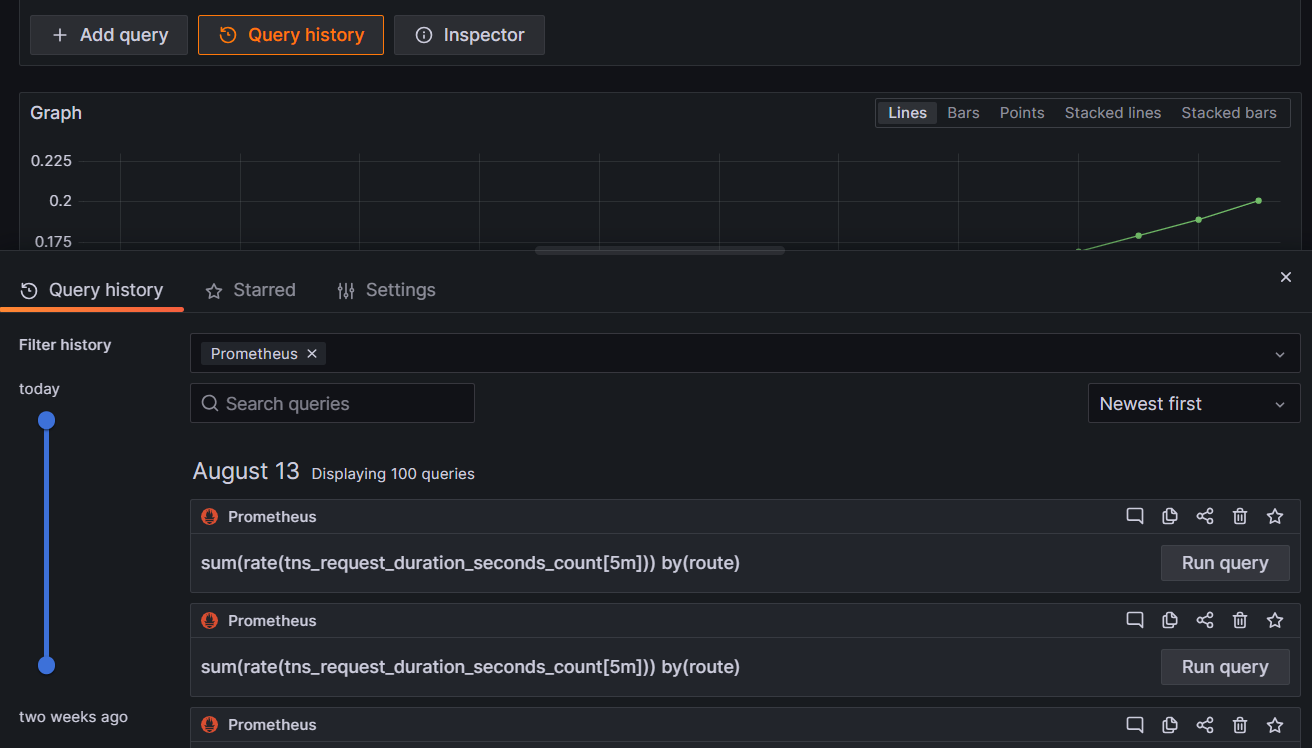
sum(rate(tns_request_duration_seconds_count[5m])) by(route)
Go back to the sample application and generate some traffic by adding new links, voting.
In the upper-right corner, click the time picker, and select Last 5 minutes.
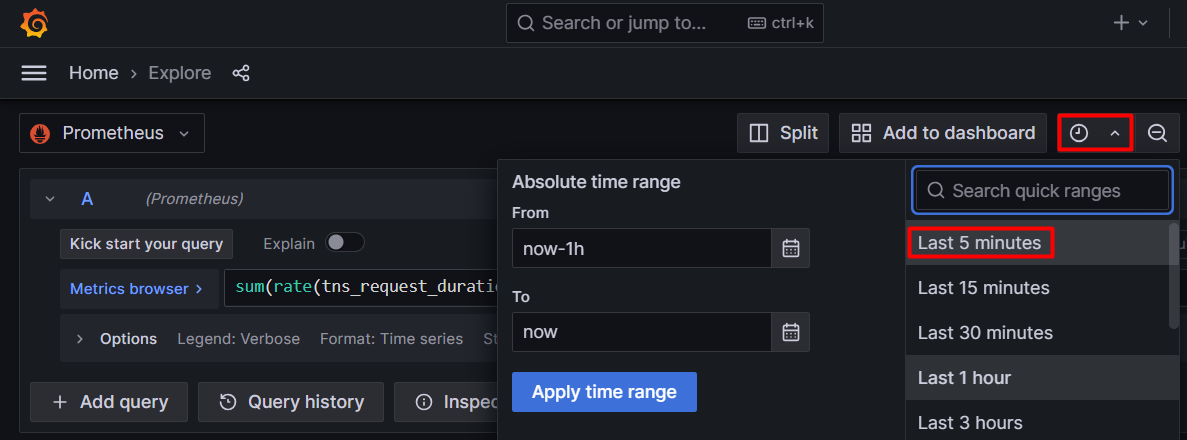
By zooming in on the last few minutes, it’s easier to see when you receive new data.
refresh the browser.

Depending on your use case, you might want to group on other labels.
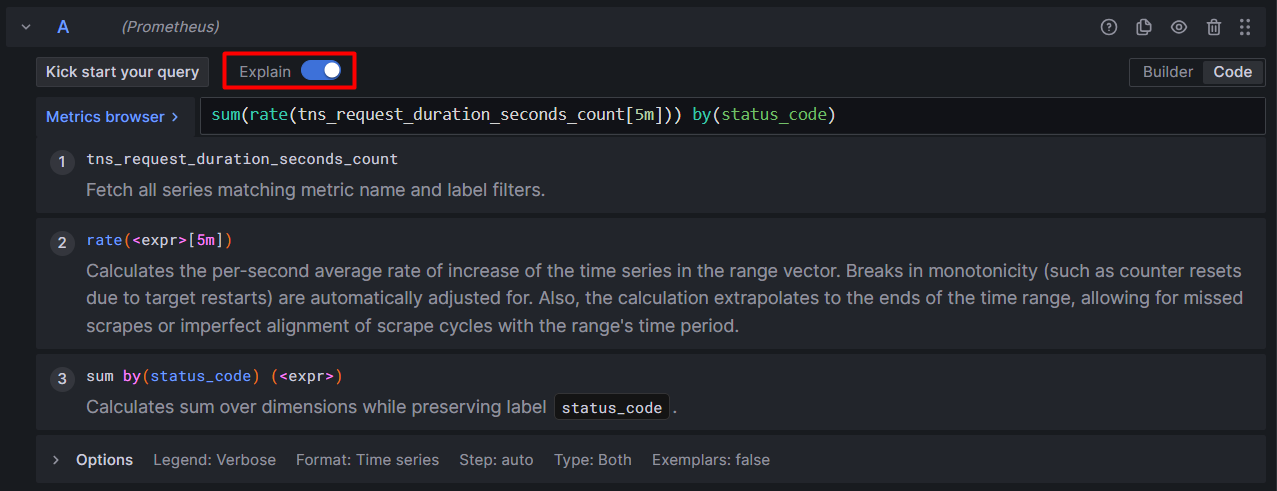
Try grouping by other labels, such as status_code, by changing the by(route) part of the query.
Click the button to read the explanation on the query parameters.
Click Query History to see the list of queries given to the system.