Grafana Setup (Docker)
Mohamad's interest is in Programming (Mobile, Web, Database and Machine Learning). He is studying at the Center For Artificial Intelligence Technology (CAIT), Universiti Kebangsaan Malaysia (UKM).
Topics:
[1] Explore metrics and logs
[2] Build dashboards
[3] Annotate dashboards
[4] Set up alerts
Prerequisites:
[1] Docker
[2] Docker Compose (included in Docker for Desktop for macOS and Windows)
[3] Git
[A] SET UP THE SAMPLE APPLICATION
[0] Create a startup folder for this tutorial
(Click Windows START button, type powershell, click "run as administrator")
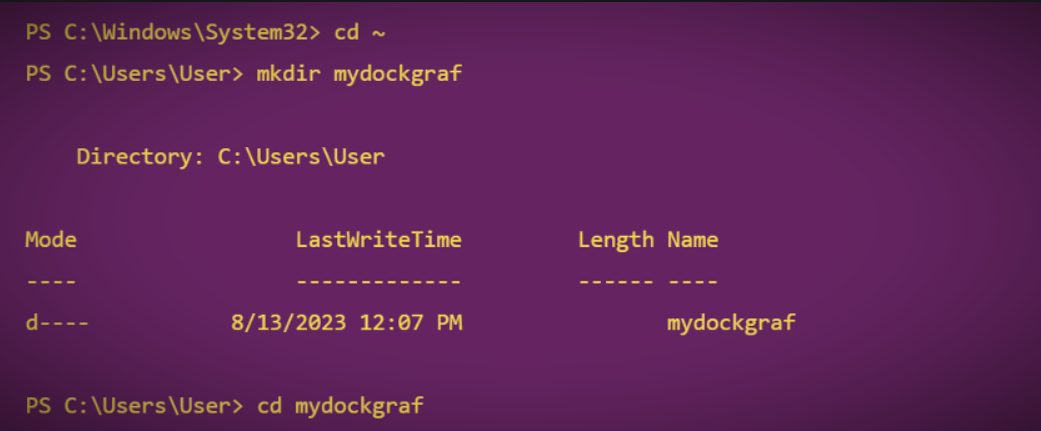
cd ~

mkdir mydockgraf

cd mydockgraf
Console output example:
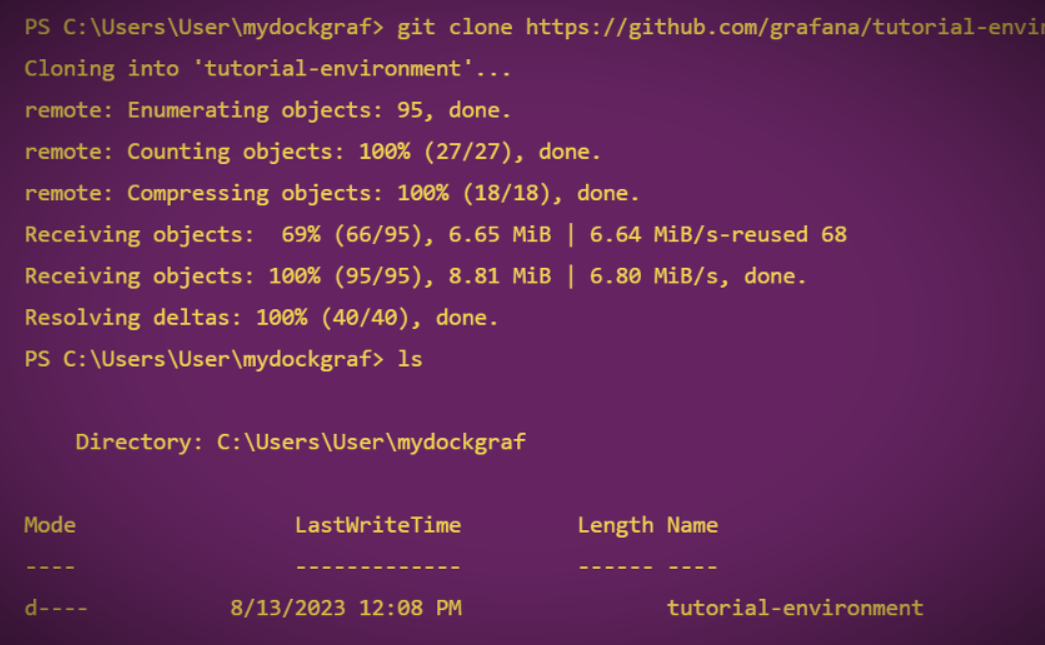
[1] Clone the github.com/grafana/tutorial-environment repository.
git clone https://github.com/grafana/tutorial-environment.git

ls
Console output example:
[2] Change to the directory where you cloned this repository:
cd tutorial-environment

ls
Console output example:

[3] Make sure Docker is running:
(Click Windows START button, type docker, click "run as administrator")
docker ps
Console output example:
(It shows that Docker is running, but at the moment there isn't any container yet)

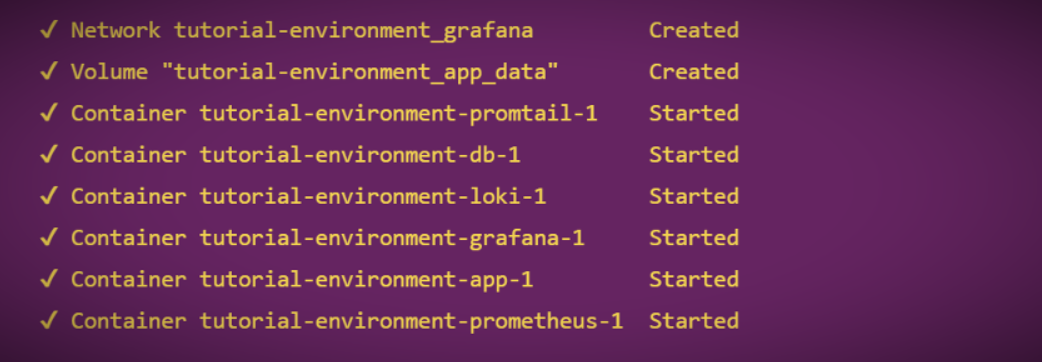
[4] Start the sample application:
docker-compose up -d
Console output example:
[5] Ensure all services are up-and-running:
docker-compose ps
.
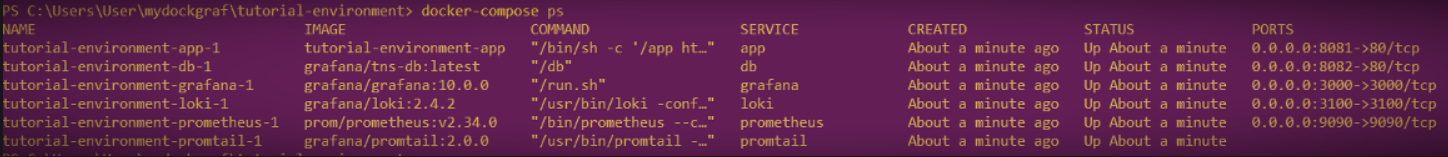
.
[6] Log in to Grafana
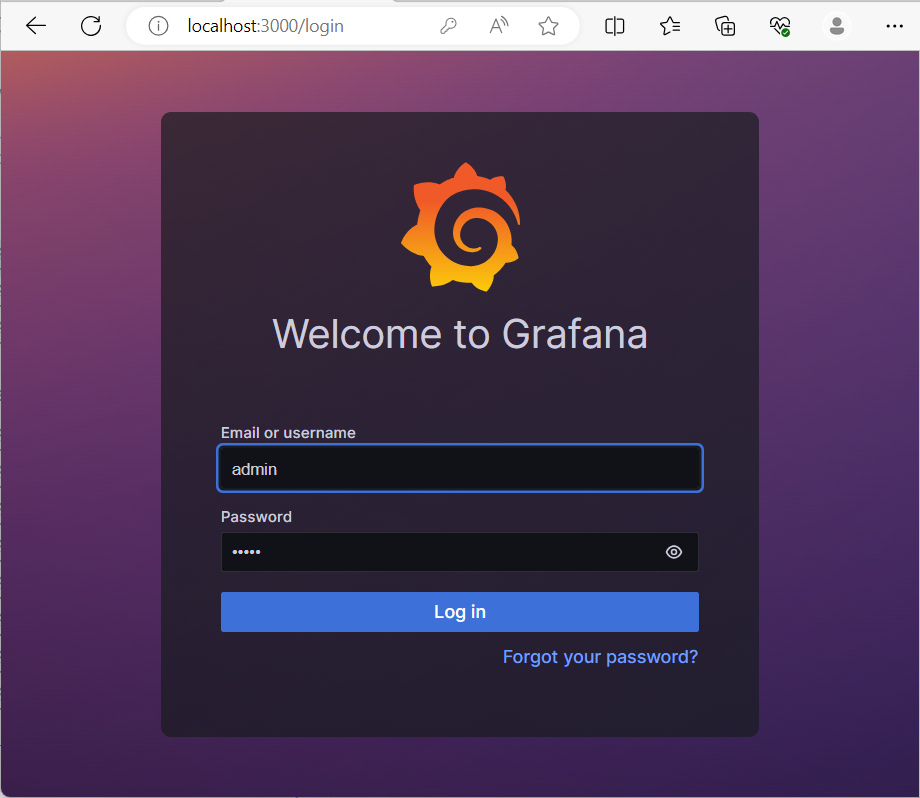
Enter username/password as admin/admin.
Grafana may ask for renewing the password. Click skip.
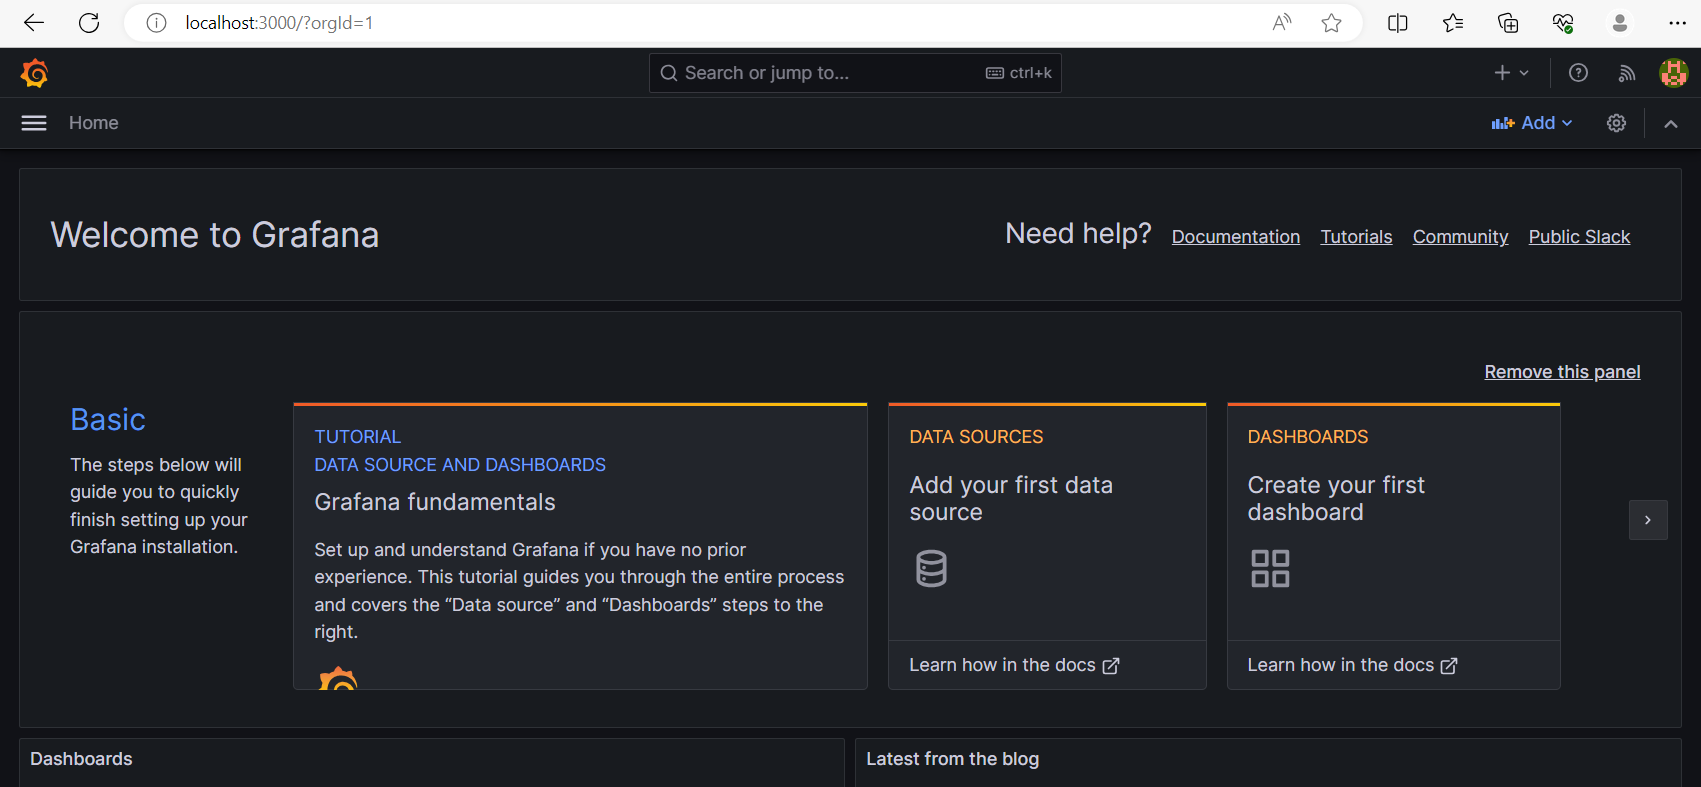
The first thing you see is the Home dashboard, which helps you get started.
To the far left you can see the sidebar, a set of quick access icons for navigating Grafana.
[7] Stopping Grafana Service
Grafana service can be stopped by running the following command:
docker-compose down
Refer to the following console output example:
