Grafana - Annotate events
Mohamad's interest is in Programming (Mobile, Web, Database and Machine Learning). He is studying at the Center For Artificial Intelligence Technology (CAIT), Universiti Kebangsaan Malaysia (UKM).
[0] Preparation
Continue from https://mohamadrazzimy.hashnode.dev/grafana-building-a-dashboard
[1] Annotations
When things go bad, it often helps if you understand the context in which the failure occurred.
Time of last deploy, system changes, or database migration can offer insight into what might have caused an outage.
Annotations allow you to represent such events directly on your graphs.
In the next part of the tutorial, we will simulate some common use cases that someone would add annotations for.
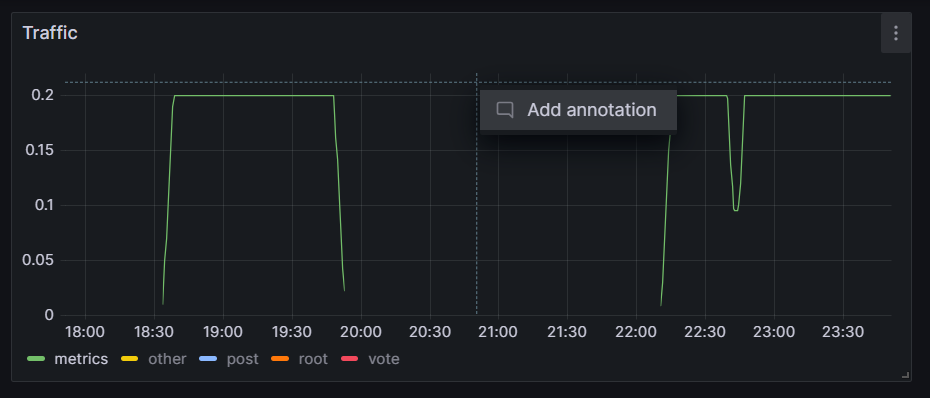
To manually add an annotation, click anywhere in your graph, then click Add annotation.
In Description, enter Migrated user database.
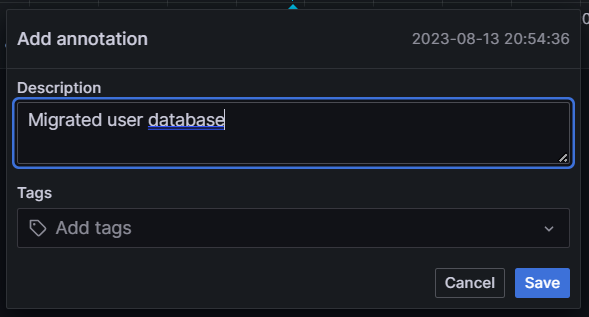
Click Save.
Grafana adds your annotation to the graph.
Hover your mouse over the base of the annotation to read the text.

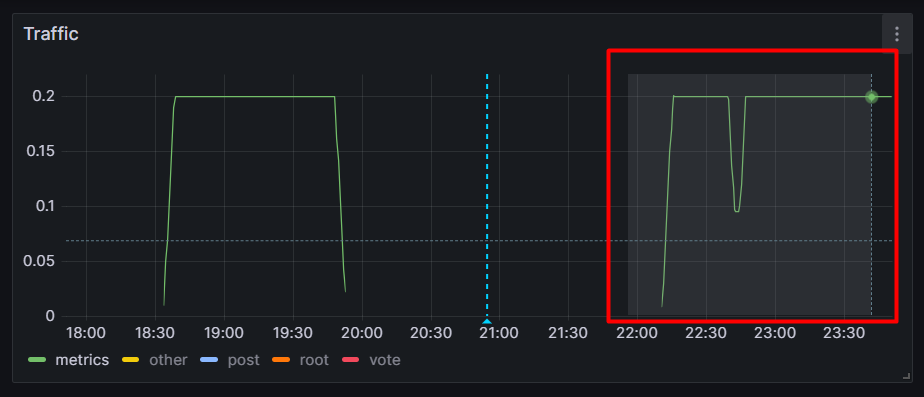
Grafana also lets you annotate a time interval, with region annotations.
[2] Region Annotations.
Add a region annotation:
Press Ctrl (or Cmd on macOS), then click and drag across the graph to select an area.
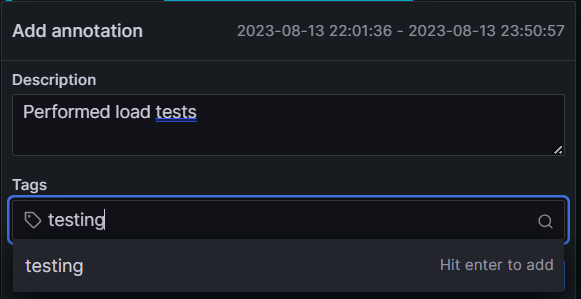
In Description, enter Performed load tests.
In Tags, enter testing.
Manually annotating your dashboard is fine for those single events.
For regularly occurring events, such as deploying a new release, Grafana supports querying annotations from one of your data sources.
Let’s create an annotation using the Loki data source we added earlier.
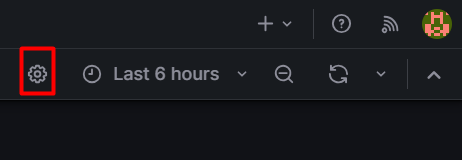
At the top of the dashboard, click the Dashboard settings (gear) icon.
Go to Annotations and click Add annotation query.

In Name, enter Errors.
In Data source, select Loki.
In Query, enter the following query:
{filename="/var/log/tns-app.log"} |= "error"
.
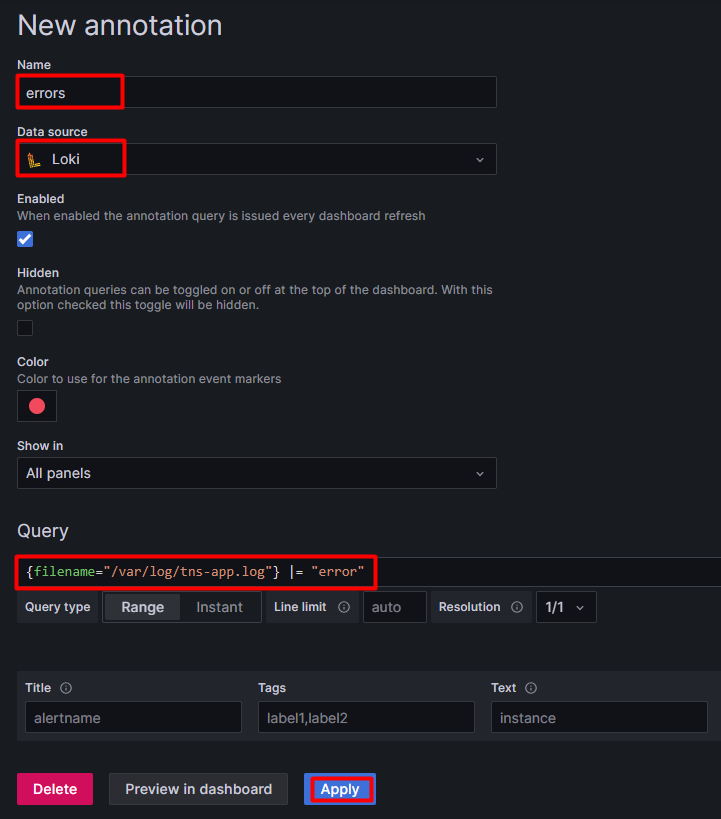
Click Apply.
Grafana displays the Annotations list, with your new annotation.

Click the breadcrumb Dashboard to return back to dashboard.
At the top of your dashboard, there is now a toggle to display the results of the newly created annotation query.
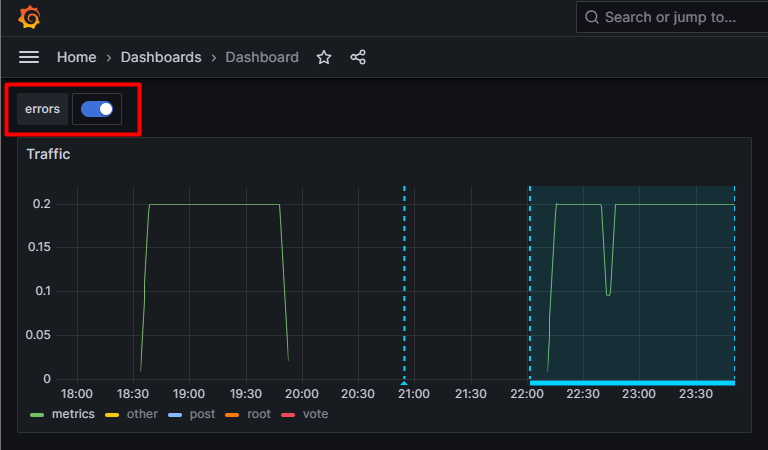
Press it so that it’s enabled.
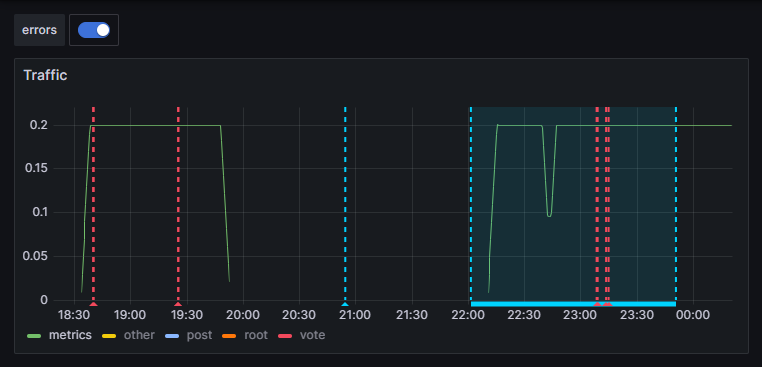
The log lines returned by your query are now displayed as annotations in the graph.
Being able to combine data from multiple data sources in one graph allows you to correlate information from both Prometheus and Loki.
Annotations also work very well alongside alerts.
In the next and final section, we will set up an alert for our app grafana.news and then we will trigger it.
This will provide a quick intro to our new Alerting platform.