Grafana - Building A Dashboard
Mohamad's interest is in Programming (Mobile, Web, Database and Machine Learning). He is studying at the Center For Artificial Intelligence Technology (CAIT), Universiti Kebangsaan Malaysia (UKM).
[0] Preparation
Continue from https://mohamadrazzimy.hashnode.dev/grafana-exploring-log-data
[1] Dashboard
A dashboard gives you an at-a-glance view of your data and lets you track metrics through different visualizations.
Dashboards consist of panels, each representing a part of the story you want your dashboard to tell.
Every panel consists of a query and a visualization. The query defines what data you want to display, whereas the visualization defines how the data is displayed.
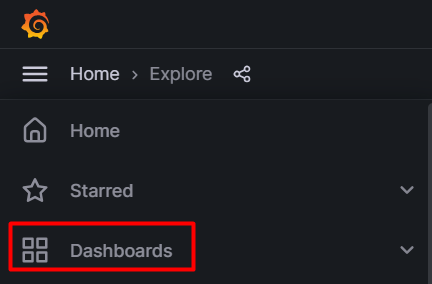
In the sidebar, hover over the Create (plus sign) icon and then click Dashboard.

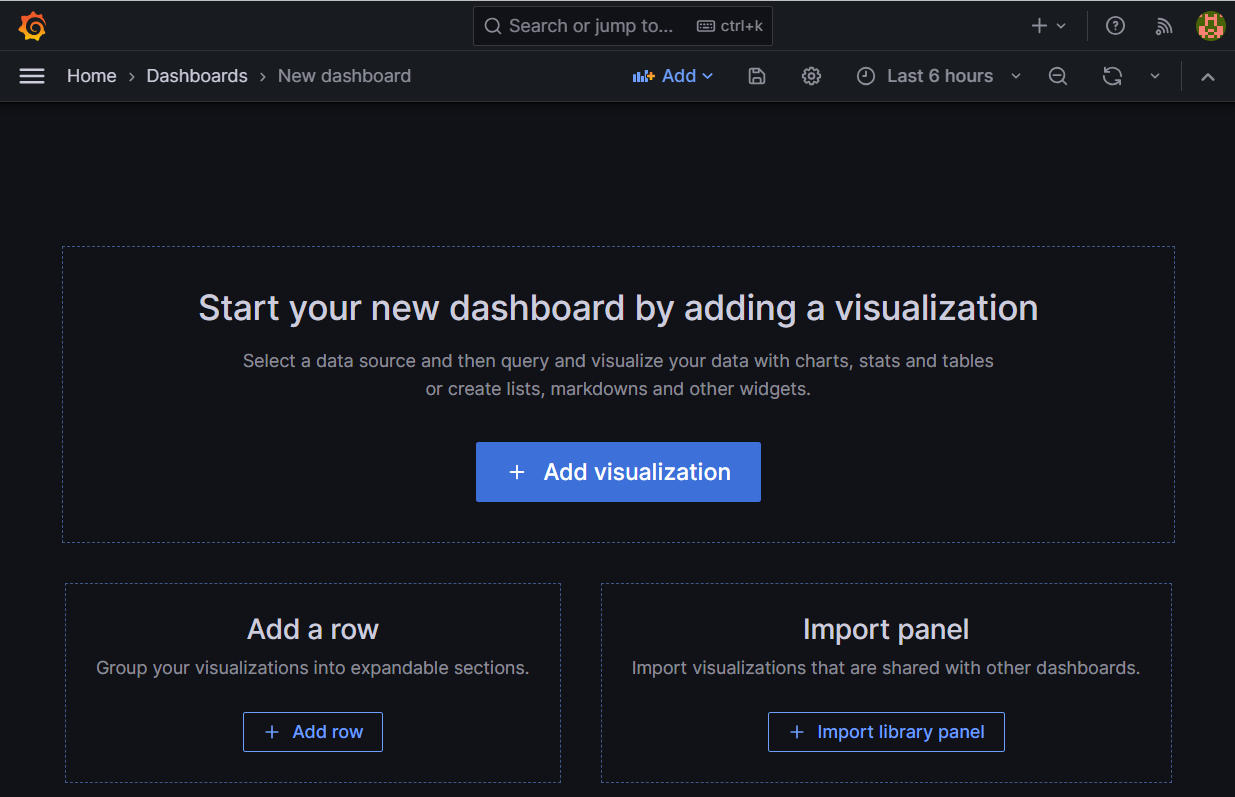
Click Add new visualization.
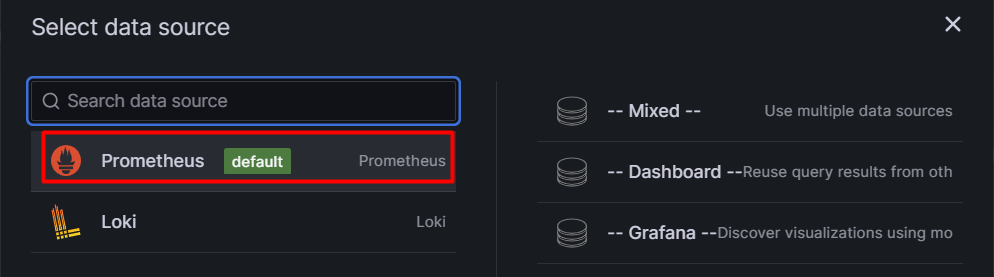
The Prometheus data source that you added will already be selected.
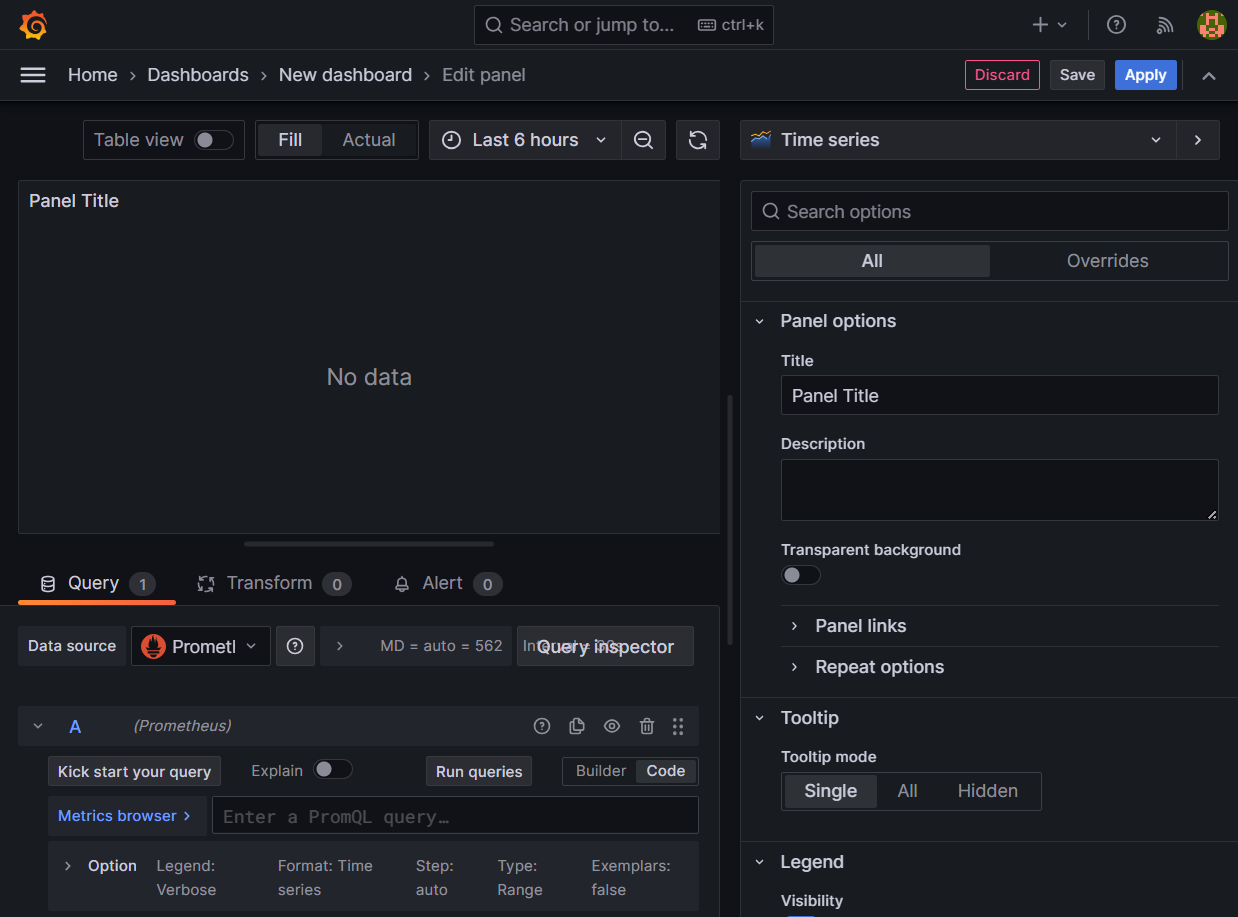
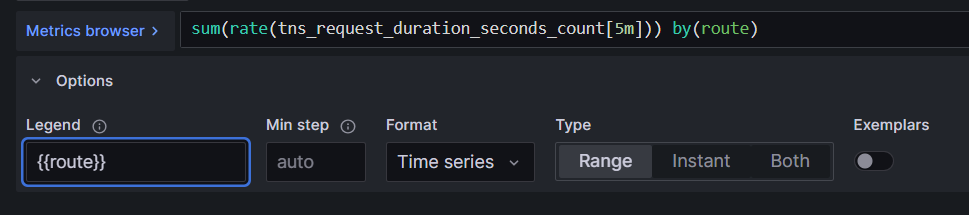
In the Query tab below the graph, enter the query from earlier and then press Shift + Enter:
sum(rate(tns_request_duration_seconds_count[5m])) by(route)

In the Legend field, enter {{route}} to rename the time series in the legend.
The graph legend updates when you click outside the field.
In the panel editor on the right, under Panel options, change the panel title to “Traffic”.
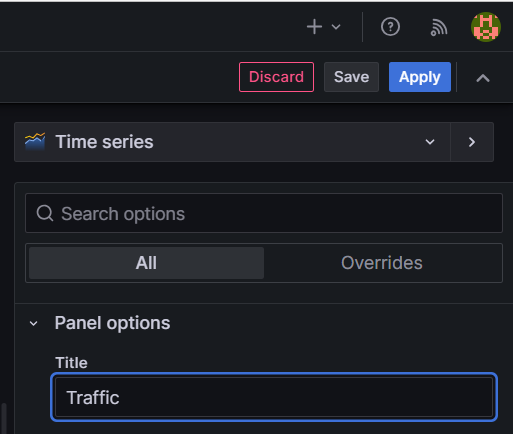
Click Apply in the top-right corner to save the panel and go back to the dashboard view.

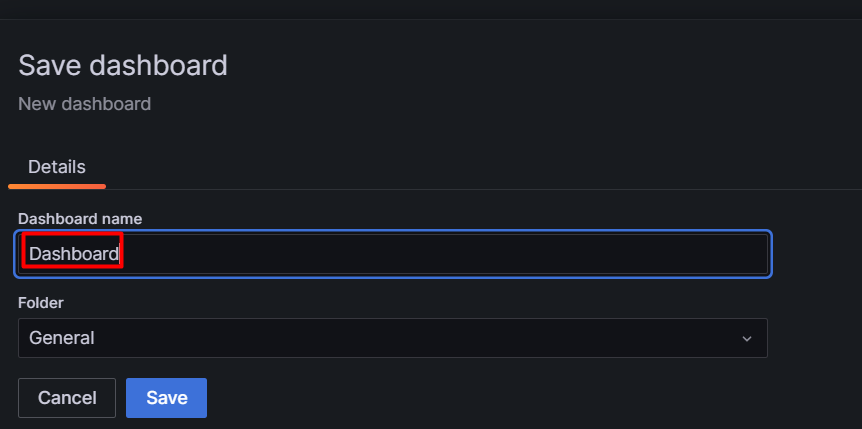
Click the Save dashboard (disk) icon at the top of the dashboard to save your dashboard.
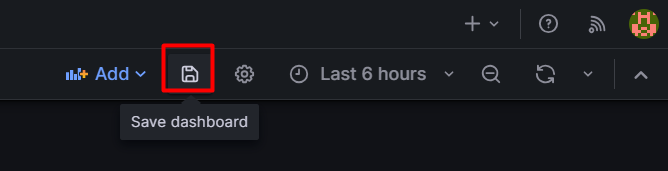
Enter a name in the Dashboard name field and then click Save.